|
SalesSummaries
|   |
Sales Summaries
In Bookmine sales can be summarised and reported using the Sales Summaries interface. From here you can specify a date range limit and specify how to group the results. For example you may wish to see sales summarised by department or main topic for the previous quarter, previous year, year to date or any other period. Or you may want to see a sales report by time intervals such as hour of the day, day of the week etc to aid you in rostering staff to match your busiest
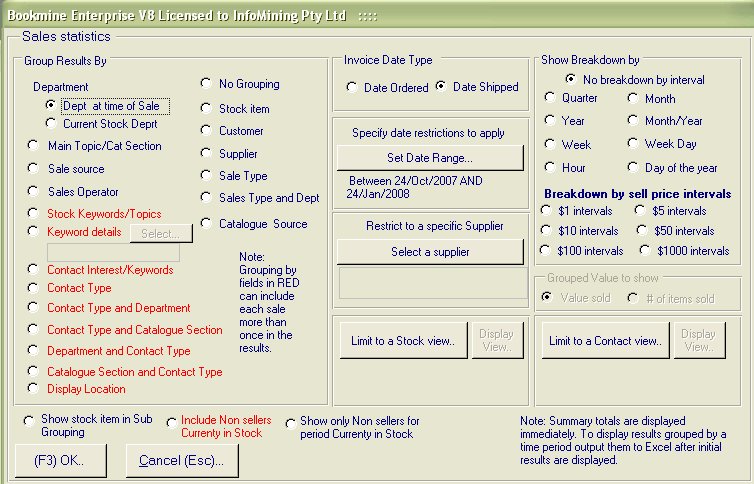
Goto the Main SWBD - Transactions(F9) - Summaries - Stock Sales. The Sales Statistices criteria interface is displayed

Sales by department or main topic etc
First select how you want the results grouped - eg if you wish to see a breakdown by department or main topic or any of the other options listed under Group By tick the appropriate radio button
To limit to sales for a specific period select the date range.
Experiment with the options to determine the reports that are most useful to you.
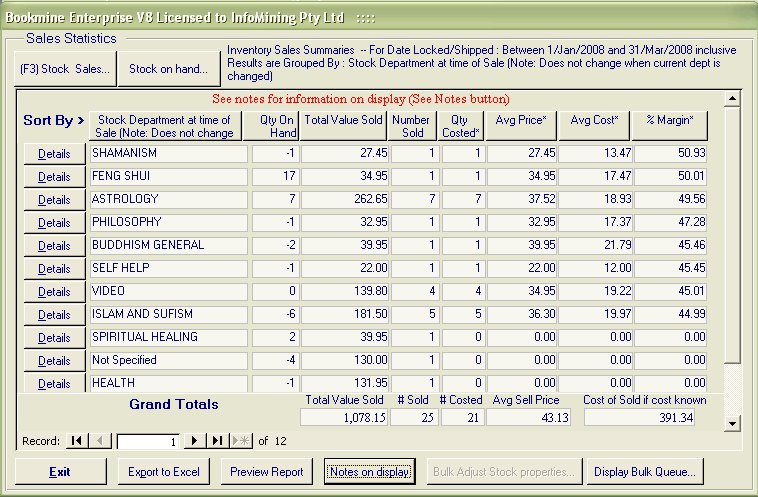
Once you have finished selecting options click the (F3) OK command. A sales listing is displayed (see below).

Sales by Time Interval - by Day, Week, Hour, Quarter
In addition to selecting a group By and Date period as above the results can be further brokern down by time interval.
From here you can view all sales for a period broken down by time intervals sych as by day of the week, hour of the day, week of the year etc to determine trends and when staff are most likely to be needed.
Select the date you want to summarise sales for as usual.
When using these functions make sure to Group By "No Grouping" otherwise you will get breakdowns by the interval selected for each of the group By sections such as Main topics. This can be a valuable report but it may produce too many breakdowns to be digestable in a single report. However if you have limited departments the report can be very valuable.
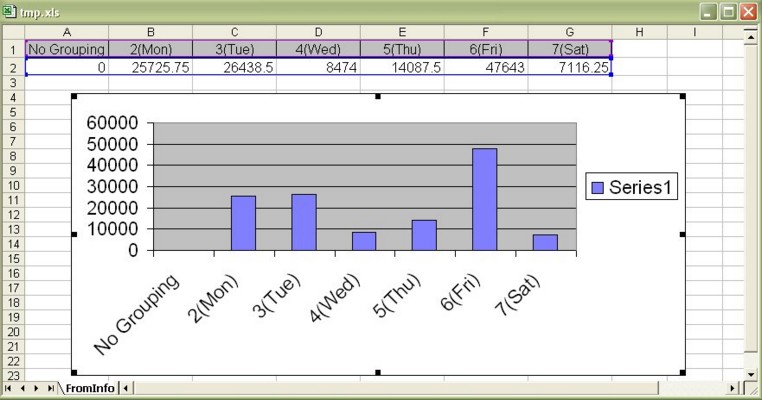
To actually view the results of the breakdown by time intervals you have to export to Excel using the Excel command which just requires a click of a button. From here you can just view the results or graph them, which is very easy. Kerry knows how to do this.
An example of Sale by day of the week for a specific date range. Reports like this take just a few sceonds to produce once the results have been output to excel using the Excel command. If Groupy By Department was selected in conjunction with the breakdown by day of the week the graph would contain the breakdown by department superimposed on the totals, colour coded by department. Experiment as the reports produced in this way are ideal for management meetings. They show sales trends that are otherwise difficult to extract from the raw data.

Notes on Summaries by Sales and Stock Holdings
Using this interface you can summarise Sales over a selected period or summarise current Stock levels (and optionally on hold).
After entering the criteria you are presented with the conforming sales or stock summaries.The results displayed are either (i) summaries for sales for the period selected, grouped by the selected category and optionally broken down into sales by a time interval (to view the breakdown the results must be output to Excel) or (ii) the value and costs of current stock holdings, optionally broken down by age.
DETAILS
The Details button on each line item can be used to display details about the item or items in that group, such as detailed sales history, suppliers, supply conditions, etc. For Contact and Suppliers the Details buttons will display the Transactions history for Contacts and the Supply details for Suppliers.
SALES STATISTICS
GRAND TOTALS - Interpretation of Grand Totals depends on the Group By category selected.
Sales Grand totals are the totals of the discounted sell price for all items sold during the period selected for that grouping category. Postage is not included in totals. Note: when grouped by "Stock Category", "Contact Type" or "Contact Interests" the Grand totals can include a single item several times, depending on the number of attributes the Inventory item or Contact has associated with them.
For example, when grouped by "Stock Category" the sale is included for each Category associated with that Stock Item. If the item has Flowers,Biology and Botany as categories/keywords the sale will be included in the totals for each of these keywords, as expected. While the Grand total is distorted in such cases the total reported for each item having that keyword is correct. The relative sales from each category can be useful for gaining insight into sales trends.
QUANTITIES - quantities displayed for sales are the total sold minus those returned from this category during the period. Negative quantities indicate that more were returned during the period than were sold. Value sold in such situations will also be negative.
SELL PRICE - The Average discounted price this item was sold for over the period.
COSTS - Costs are included where a cost was available at the time of invoicing. The cost used is a running average cost based on deliveries prior to the sale date. If the unit cost of an item does not change between deliveries the running cost will be equal to the last delivered cost. Please Note: If the user wishes to track batches of individual items through the delivery and sales cycle they would have to create a new Stock record to represent that item in that delivery instead of using the barcoded product code (EAN, ISSN or ISBN) provided on most items. For example each CD has its own product code already stamped on it. This is typically represented in the program as a single stock item. When each delivery is made a unit cost is recorded. This is stored for future reference. This cost may differ between deliveries. There may also be a quantity of the CD in already in stock. The cost recorded for the next sale of this CD is now the average between the new delivery cost and those already in stock as there is no way to identify from which delivery the CD came from. That is unless you use separate stock records to individually track each delivery batch of each item. This would require lots of extra work for very little gain. However the application will handle this if required.
BREAKDOWN BY TIME OR PricePoint INTERVALS - The results shown on the form are totals for the entire period selected. If breakdown by time was selected, e.g. results are to be broken down by week, Quarter, etc the full results can be viewed by exporting to Excel where they can be manipulated and graphed if required.
MARGIN - % Margin can be calculated only where both the sell price and cost price are non zero.
%Margin = 100*(SellPrice - Cost)/SellPrice] for items where both the cost and selling price is known
STOCK On Hand summaries
COSTS - Costs are included where a cost is available. The cost used is taken from the most recent delivery for the item.
SELL PRICE - Average selling prices taken from Stock record.
% MARGIN - Margin can only be calculated where both the sell price and cost price are non zero and uses the live sell price.
Stock Turn
A financial ratio which shows how fast a company sells its goods, calculated as: sales divided by year-end stocks. If, for example, a company has sales of £60m and a year-end stock figure of £3.2m its stockturn multiple is 18.85.
Stockturn is particularly relevant for manufacturing or retailing businesses. The higher the figure, the more efficient the company is in processing stock. The typical multiple for a manufacturer is 5 to 6. Retailers that are doing well and run efficiently will have a much higher multiple because they should be able to put the burden of carrying stock on their suppliers.
Another way of looking at stock is to calculate the number of days on average that a company keeps its stock. This is expressed as the year-end stock figure divided by the sales, and multiplied by 365. Using the figures above, £3.2m divided by £60m, then multiplied by 365 = 19.46 days.